Results Revealed for 2022 Apparel Decorators Survey
A range of diverse technologies are required in today’s competitive market, but screen printing continues to serve as the anchor.
SCREEN PRINTING MAGAZINE and Keypoint Intelligence recently conducted a survey of the apparel industry to capture a profile of apparel decorators, their business models, average monthly volumes, decorating technologies currently used and the annual percentage of volume produced, planned purchases for new decorating technologies and the planned budget, as well as reasons why certain decorating technologies were not used. The survey also asked about the average weekly uptime of technologies and unscheduled maintenance issues with their decorating technologies, budgeted hourly rates for key positions within their company, the cost of goods sold and the selling price per technology used to the customer, labor and supply chain disruptions and the impact on their business, and changes in their business revenue since 2019. Presented here are the key findings from this study.
Demographics
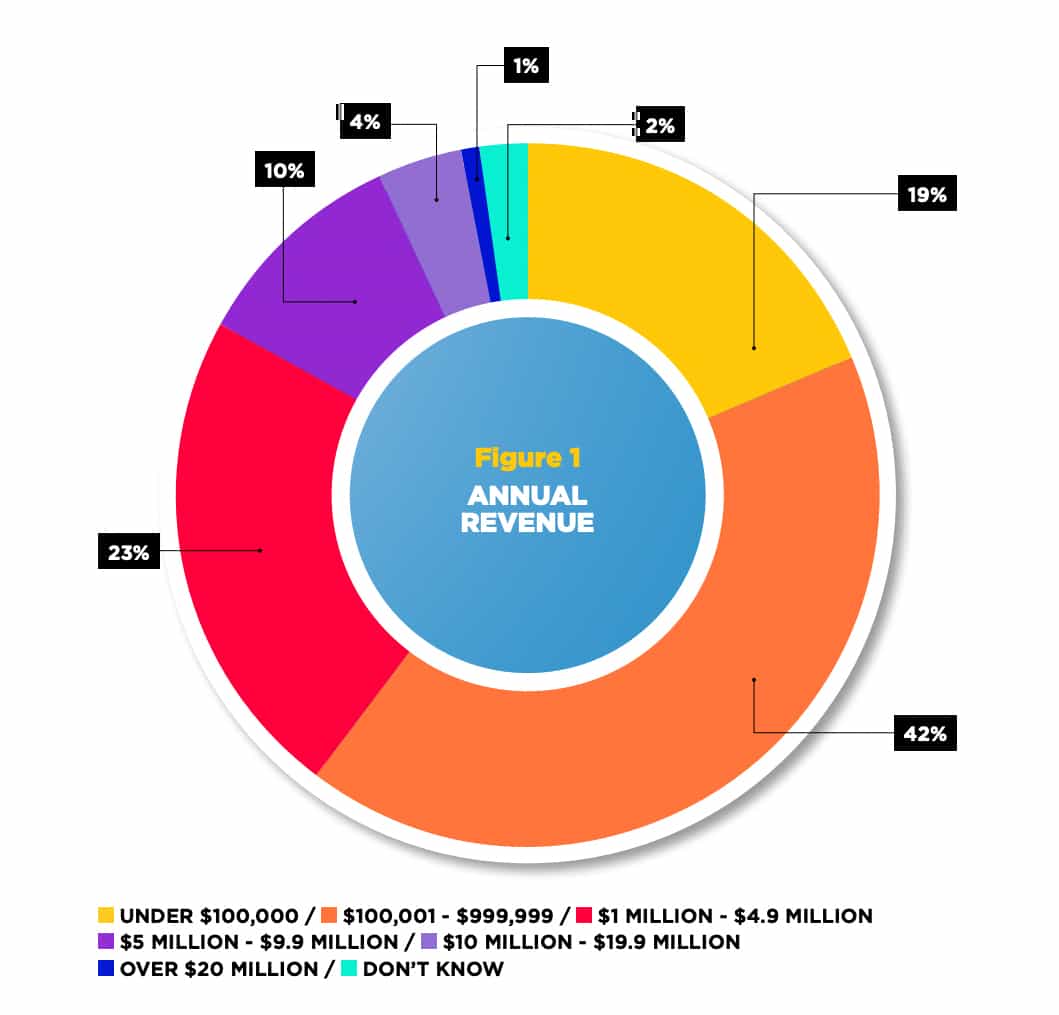
There were 110 total respondents to the survey with annual revenue distributions shown in Figure 1. Looking at the type of respondent businesses, 43 percent identified as a custom printer (B2C), 19 percent identified as a contract printer (B2B), and 38 percent identified as custom and contract (B2C and B2B). The results of the survey also showed that 59 percent of the respondents held the title of CEO, president, or owner; 12 percent general manager or managing director; 4 percent COO; VP of manufacturing, or CTO; 15 percent VP of sales/marketing; 6 percent prepress/production manager or supervisor; and 4 percent other.
Respondents were asked to indicate which printing and decorating technologies they currently used in their production facility, which is presented in Figure 2. The chart clearly shows the range of diverse technologies required in today’s competitive market, with screen printing serving as an anchor with 55 to 60 percent of all respondents having manual or automatic screen-printing equipment.
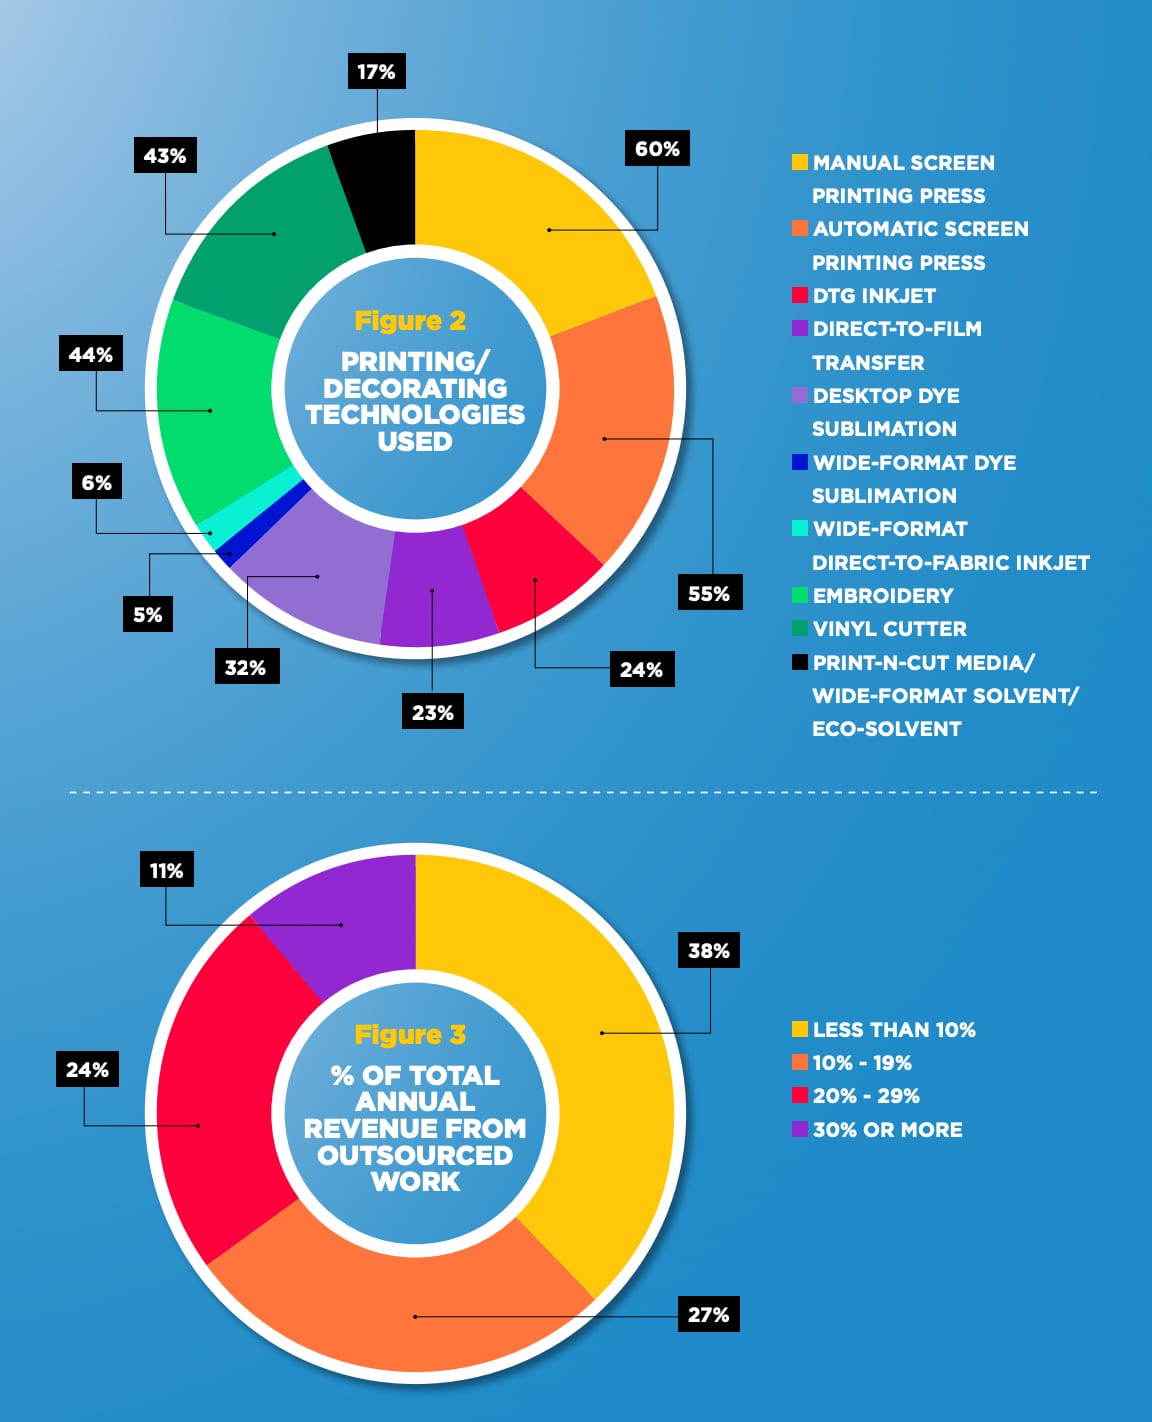
For technologies currently not used, respondents were asked how they handled orders and requests with a customer inquiry outside their capabilities. On average, 49 percent indicated they accepted the order and outsourced it to a partner, 27 percent indicated they referred the customer to another business, and 24 percent indicated they told the customer they could not produce the order. For those respondents who outsourced work, Figure 3 shows what percentage of their total annual revenue is from outsourced work, with 35 percent of respondents indicating at least 20 percent or more and 65 percent indicating outsourcing is 19 percent or less of their total annual revenue.
AdvertisementPlanned Purchases
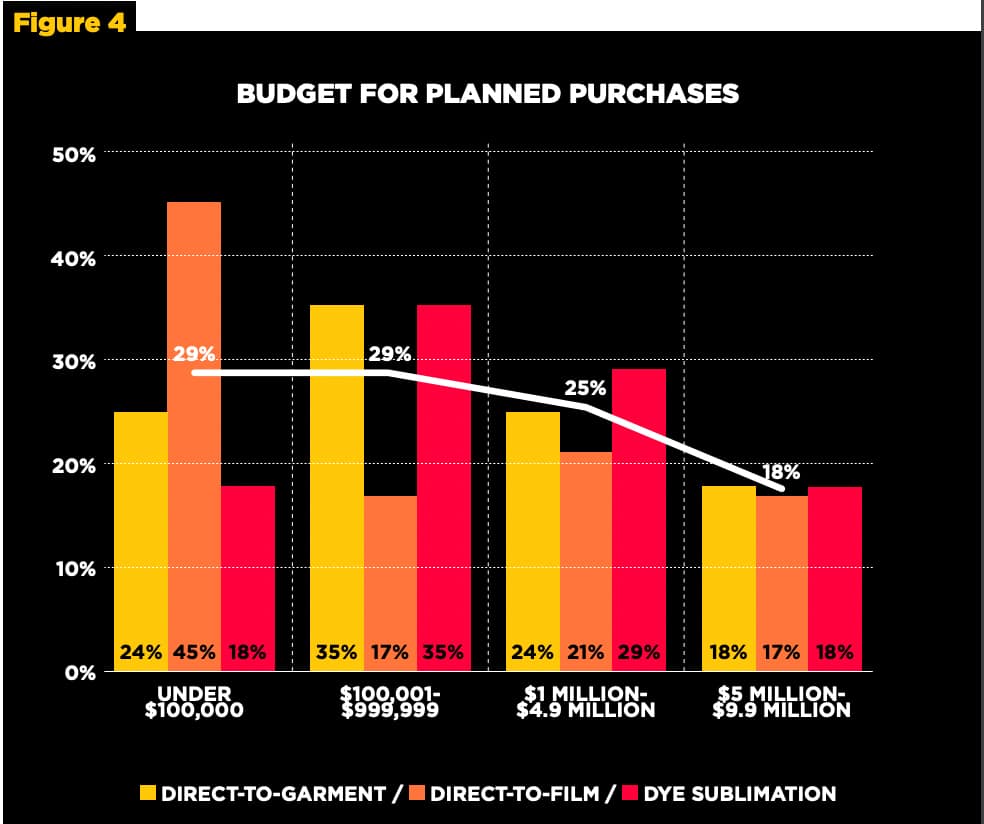
Respondents who indicated they are planning to purchase direct-to-garment, direct-to-film, or dye sublimation devices were asked to select their planned budget range, which is shown in Figure 4. This shows there’s an even distribution of budgets planned for the survey respondents with an average of nearly 60 percent planning to spend up to $999,999 and an average of 25 percent planning to spend between $1 million and $4.9 million.
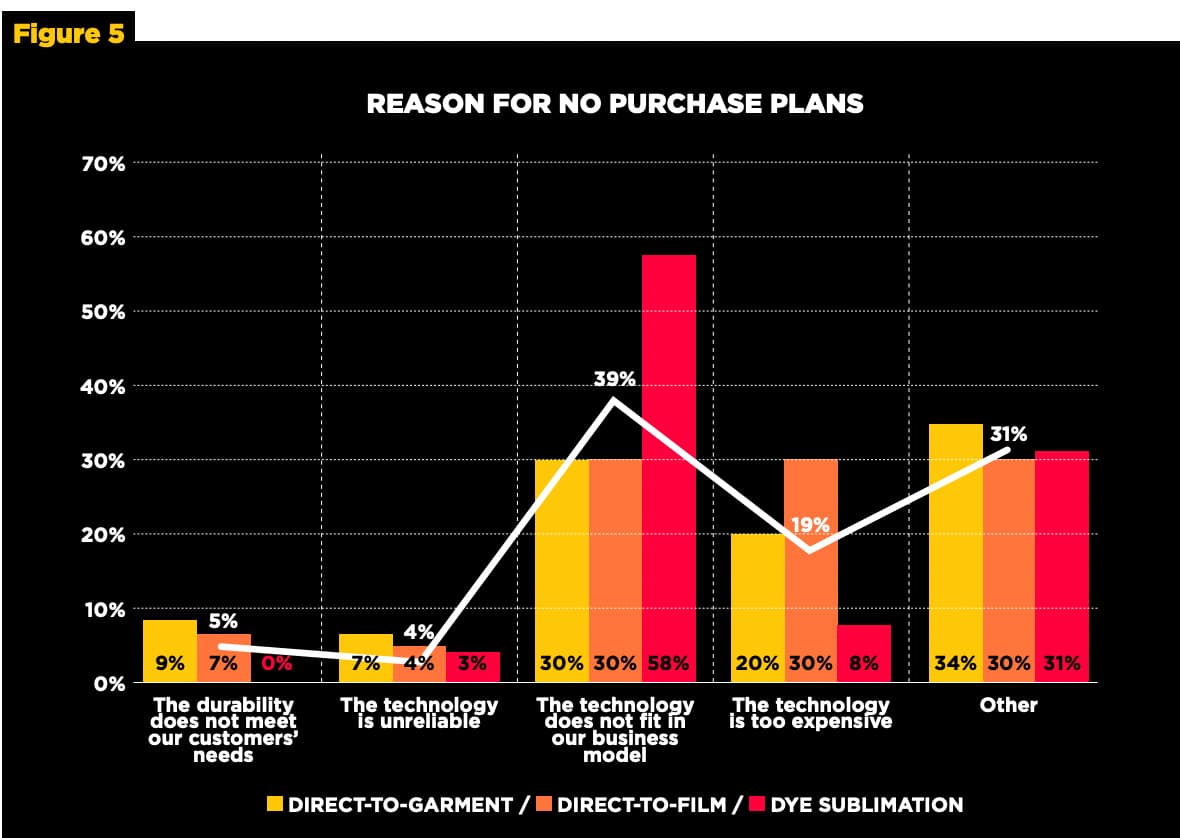
Respondents who indicated they had no plans to purchase DTG, DTF, or dye sublimation were asked why. The results are shown in Figure 5. On average, 39 percent of respondents said the technology does not fit their business model, 19 percent said the technology is too expensive, and 31 percent cited other reasons. Only four percent, on average, indicated the technology is unreliable, which suggests that reliability of digital technology is not an issue among survey respondents.
Average Weekly Uptimes
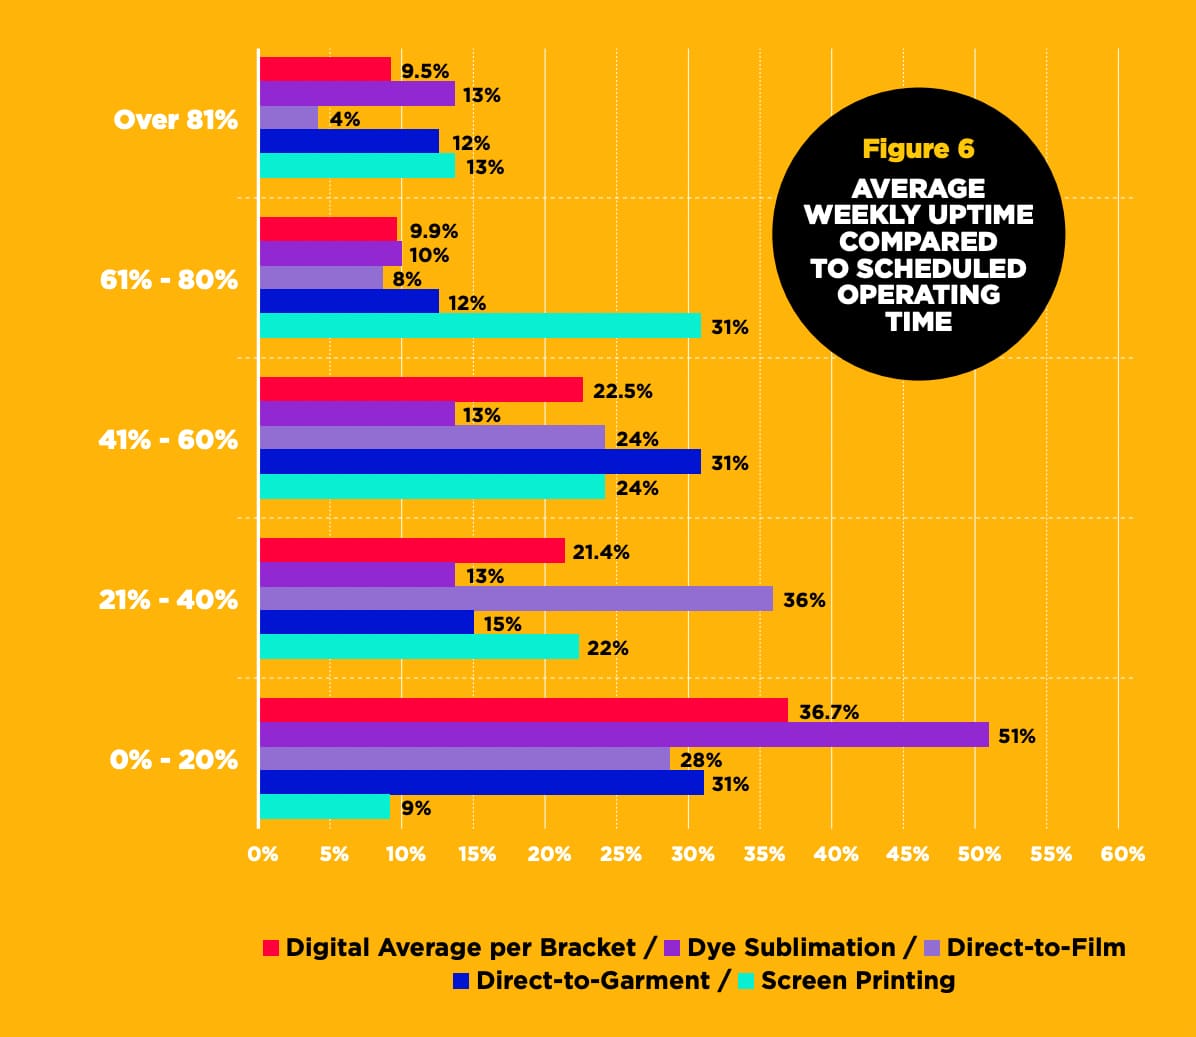
Respondents were asked the average weekly uptime compared to scheduled operating time for screen printing, direct-to-garment, direct-to-film, and dye sublimation devices used in their businesses, which are shown in Figure 6. It is interesting to note in this survey data that screen printing weekly uptime above 41 percent was selected by 68 percent of all respondents who use screen printing, whereas an average of only 41.9 percent of respondents who used digital technology fell above 41 percent uptime. Figure 9 includes an average of direct-to-garment, dye sublimation, and direct-to-film technologies represented as “Digital Average per Bracket” in the graph.
Costs + Selling Prices
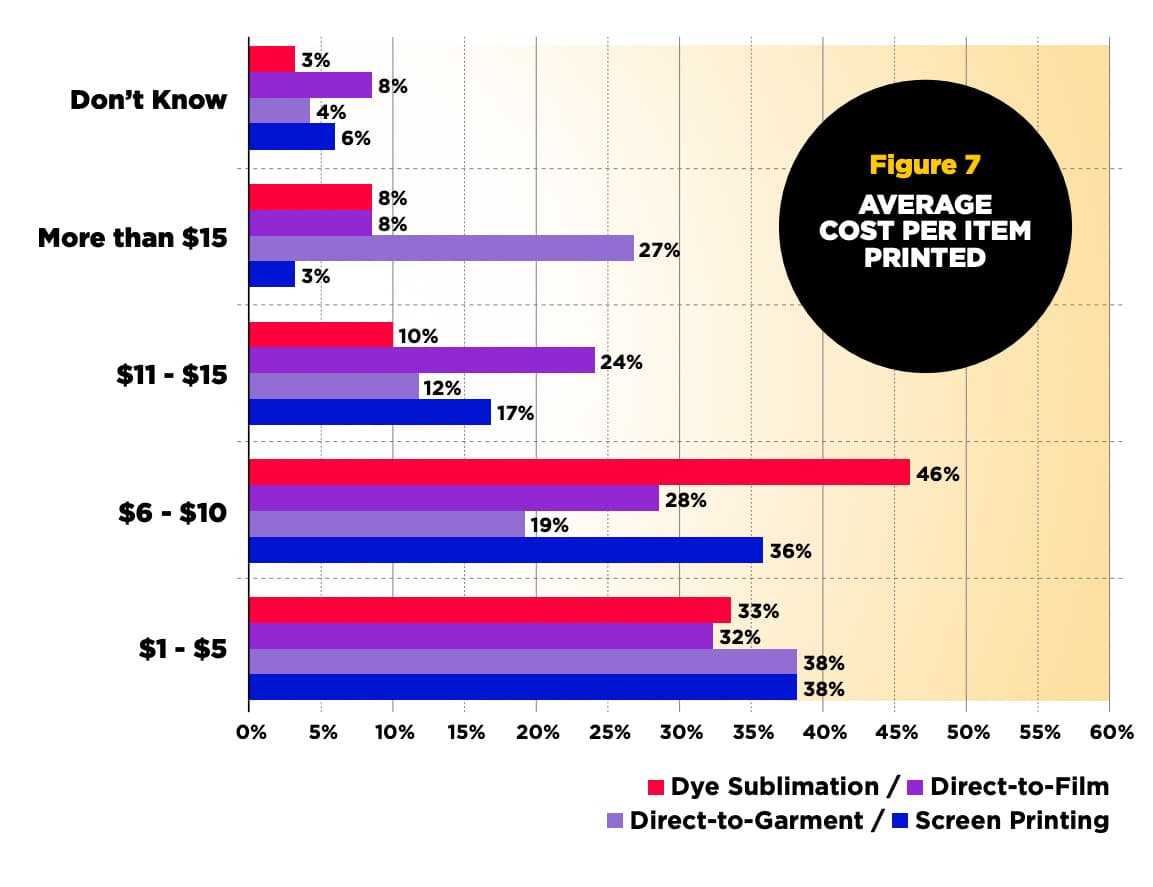
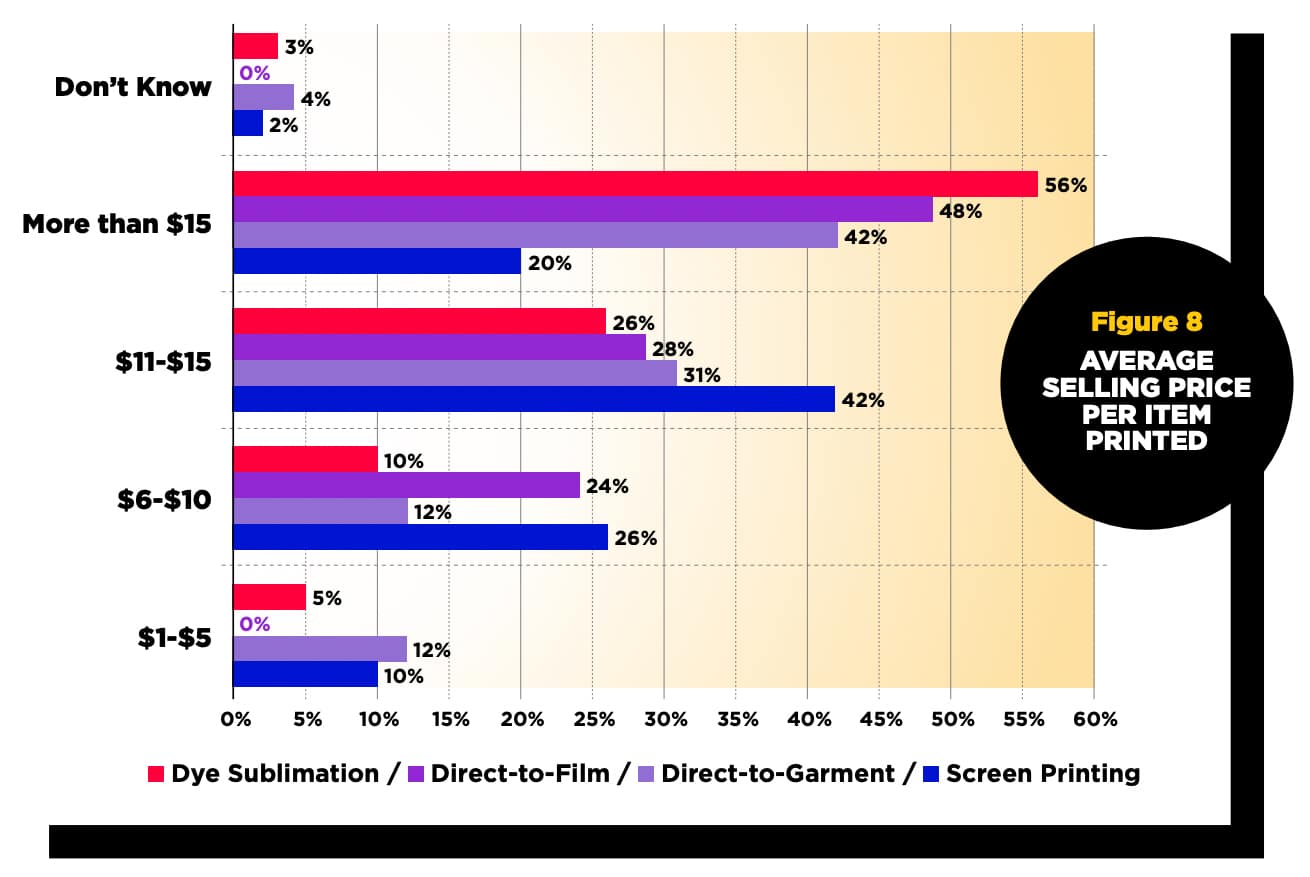
Respondents were asked to select a given range for the overall costs per unit produced using the various technologies utilized in their business and a range for the selling price per item sold to their customers, which are represented in Figures 7 and 8. The majority of respondents indicated that the total cost is between $1 to $5 per item produced (35 percent average) and the selling price is at least $11 per item sold (41 percent average).
The survey asked several questions related to the frequency of errors incurred each month and the amount of time lost due to these errors. Figures 9 and 10 indicate the responses received. Notice the survey respondents rarely selected an error occurs often. Most selected “seldom” for the given errors.
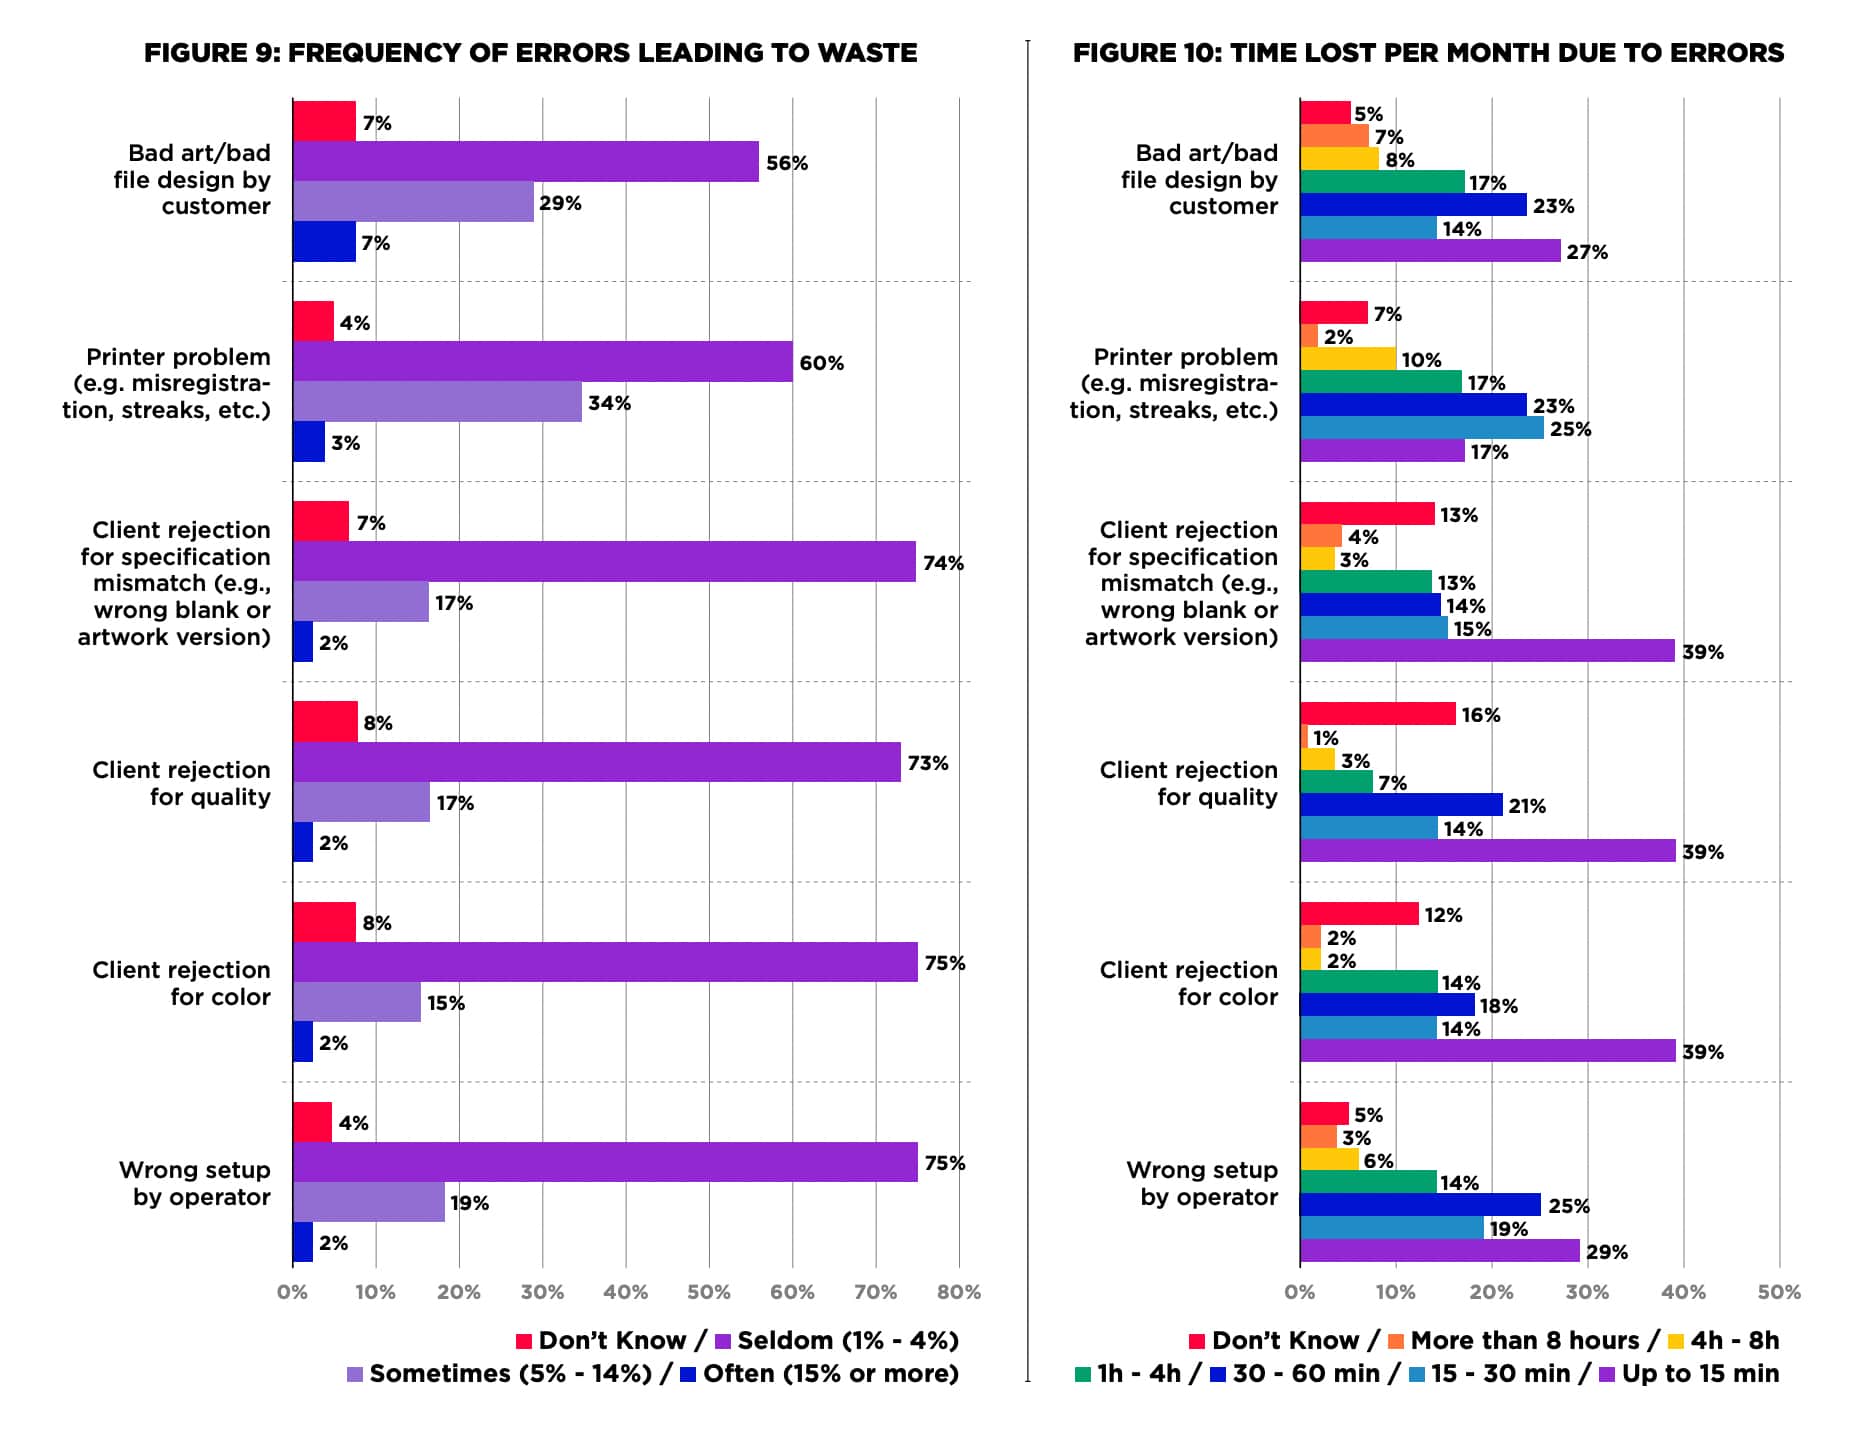
Figure 11: Budgeted Hourly Rate Used for Print Estimating
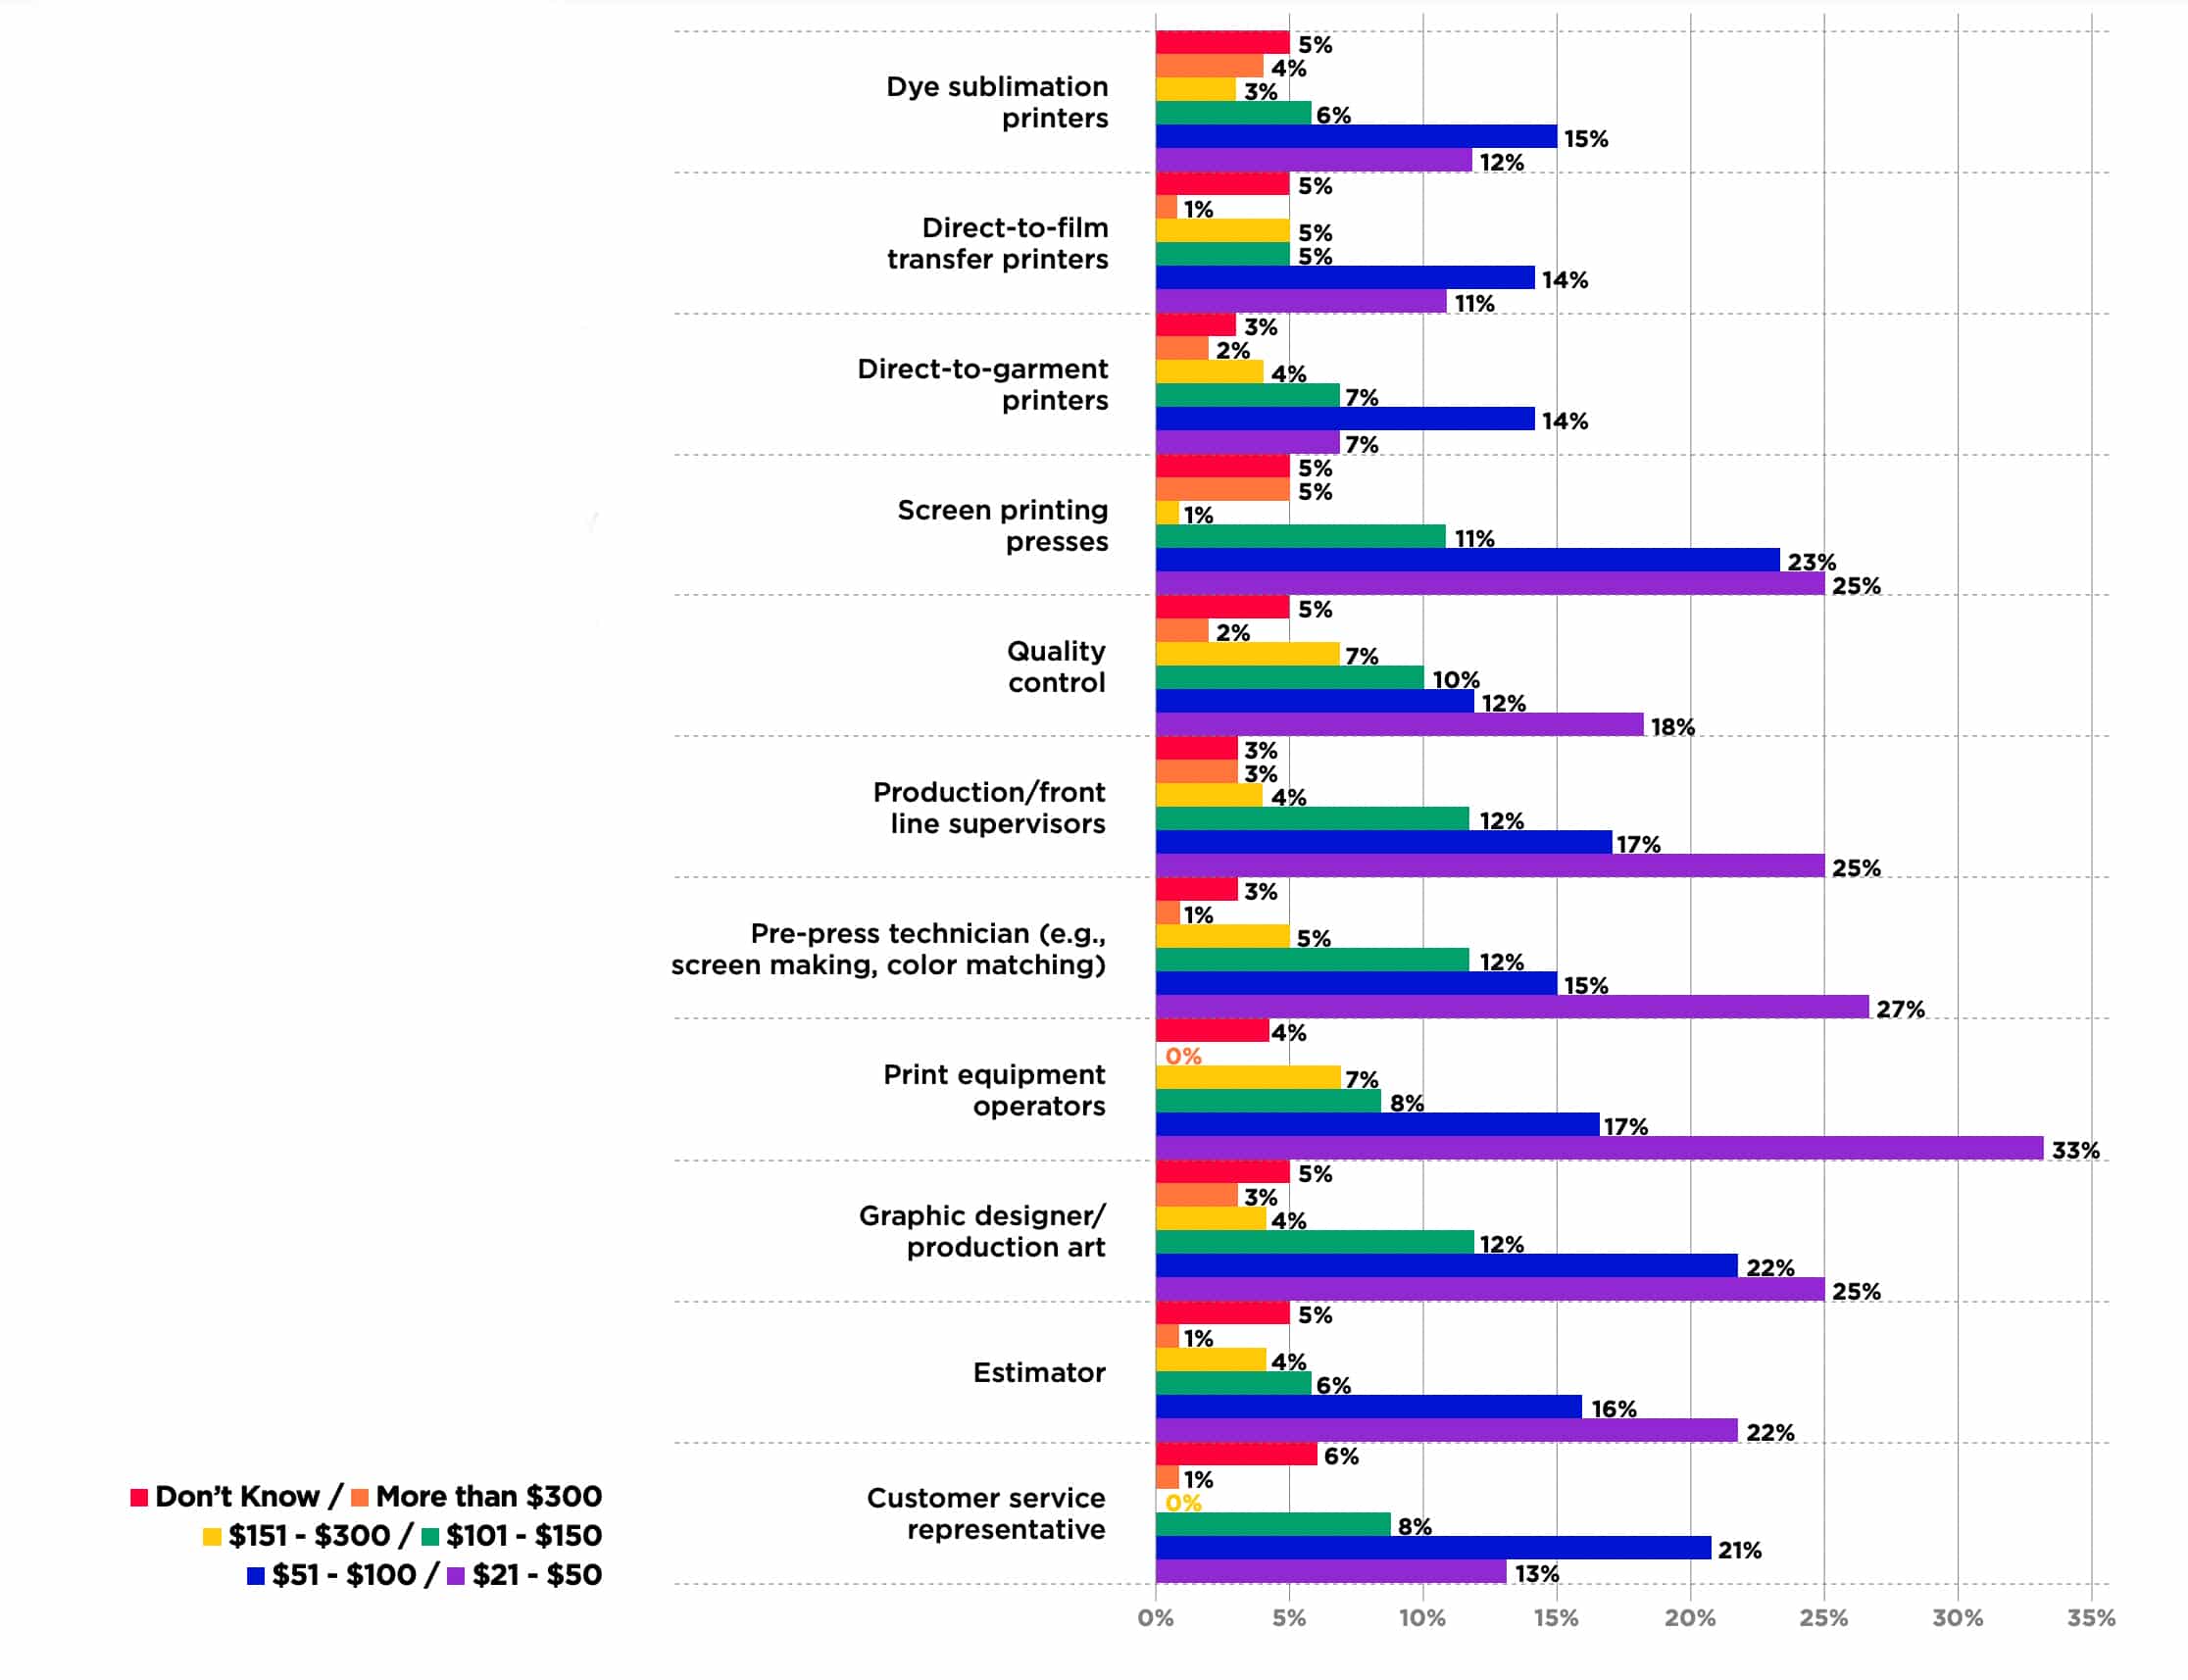
The respondents were asked to select the appropriate range of figures for the budgeted hourly rate used for print estimating for a variety of positions. Figure 11 illustrates the averages for the range of rates included. Nearly 50 percent of responses fell between $21 to $300 per hour, with 45.6 percent of responses falling between $21 to $150 per hour.
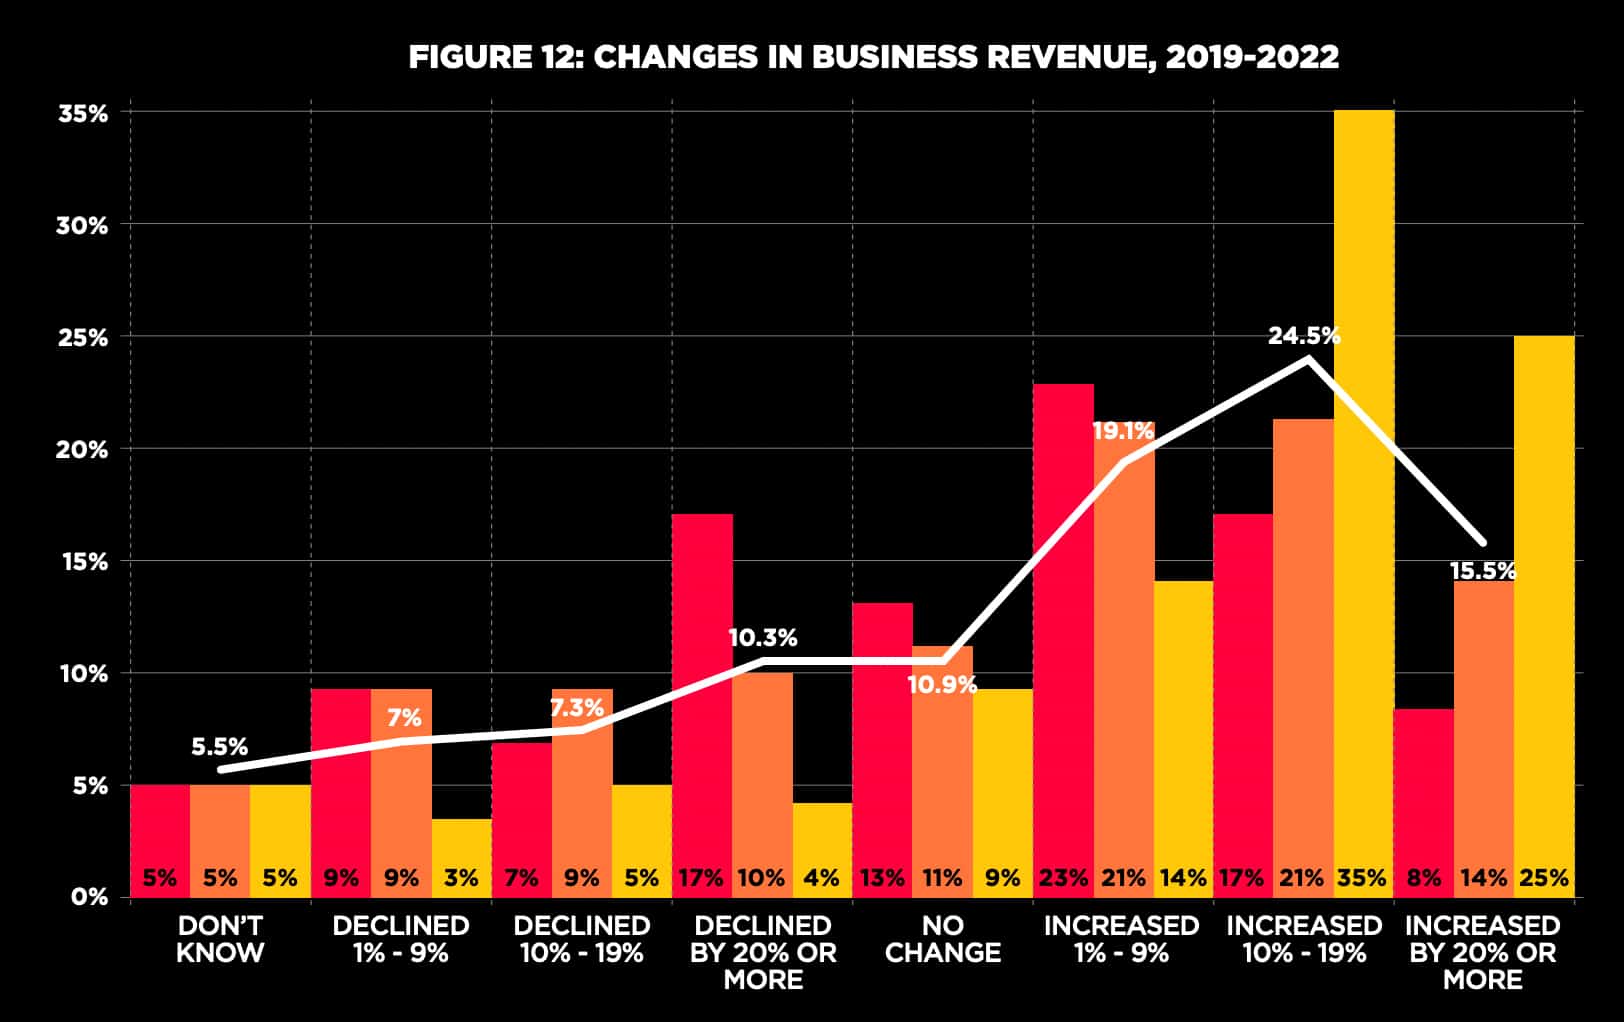
Respondents were also asked how their business revenue had changed between 2019 to 2020, 2020 to 2021, and their expectation for 2022. Figure 12 shows 70 percent of respondents indicated, at minimum, no change to their business revenue occurred from 2019 to what they are expecting for 2022, with 59.1 percent experiencing a 1 to 20 percent increase in business revenue during that same period.
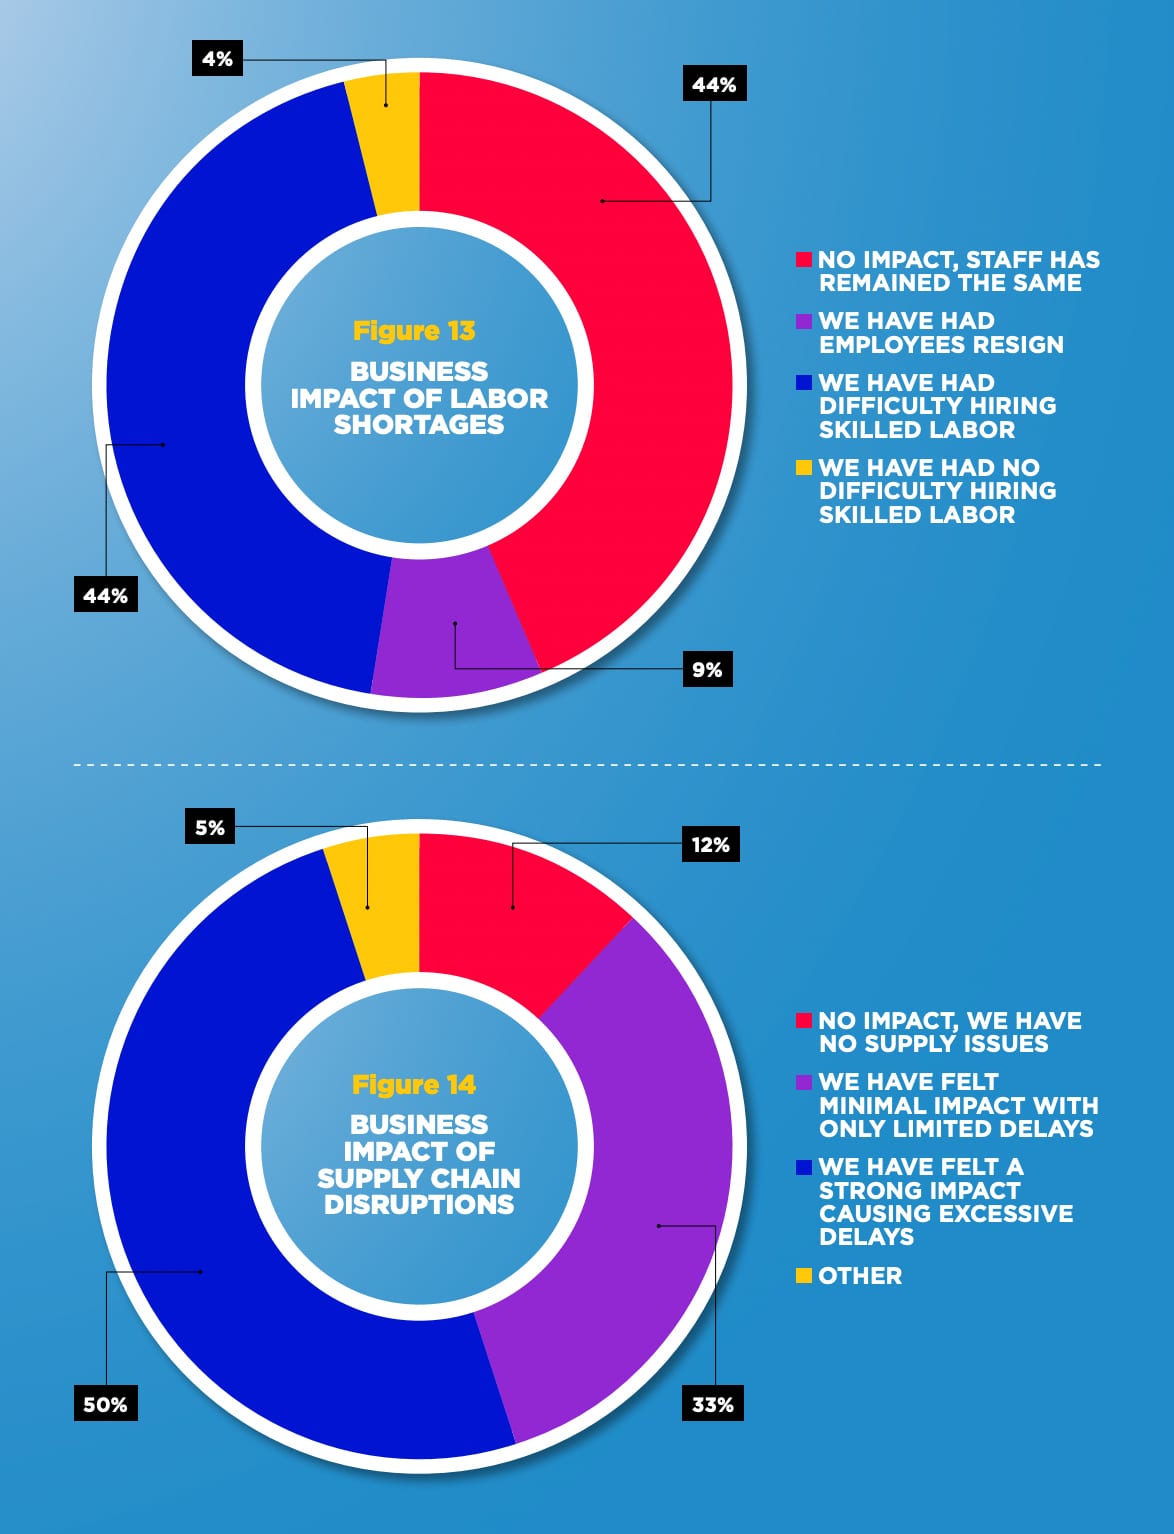
The survey asked about the impact of labor shortages and supply chain disruptions and the impact these have had on their business. Figure 13 shows labor shortages have led to 44 percent of respondents having difficulty hiring skilled labor and 44 percent indicated the labor shortages have had no impact on their businesses. Respondents were also asked how supply chain disruptions have impacted their business. Figure 14 clearly shows supply chain disruptions have caused a strong impact on business, causing excessive delays with 50 percent of respondents whereas only 33 percent indicated they have felt minimal impact with only limited delays.
AdvertisementThe data from the survey illustrates the apparel decorating industry is technologically diverse in the platforms it uses and nearly all respondents are planning a purchase in the next 24 months. Additionally, the main reason given for those respondents who have no planned purchases of digital printing equipment has more to do with the business model versus unreliable technology or costs. Differences between costs to produce an item and the selling prices of those items indicates a markup of up to 100 percent or more. Nearly 50 percent of responses indicated the budgeted hourly rate used to estimate print jobs fell between $21 to $300 per hour, with 45.6 percent of responses falling between $21 to $150 per hour. Regarding business revenue performance between 2019 and what is expected for 2022, 70 percent of respondents indicated, at minimum, no change to their business revenue occurred from 2019 to what they are expecting for 2022, with 59.1 percent experiencing a 1 to 20 percent increase in business revenue during that same period.
Let’s Talk About It
Creating a More Diverse and Inclusive Screen Printing Industry
LET’S TALK About It: Part 3 discusses how four screen printers have employed people with disabilities, why you should consider doing the same, the resources that are available, and more. Watch the live webinar, held August 16, moderated by Adrienne Palmer, editor-in-chief, Screen Printing magazine, with panelists Ali Banholzer, Amber Massey, Ryan Moor, and Jed Seifert. The multi-part series is hosted exclusively by ROQ.US and U.N.I.T.E Together. Let’s Talk About It: Part 1 focused on Black, female screen printers and can be watched here; Part 2 focused on the LGBTQ+ community and can be watched here.


Inkcups Announces New CEO and Leadership Restructure

Hope Harbor to Receive Donation from BlueCotton’s 2024 Mary Ruth King Award Recipient

Livin’ the High Life


Bulletins
Get the most important news and business ideas from Screen Printing magazine's news bulletin.
-

 Art, Ad, or Alchemy1 month ago
F&I Printing Is Everywhere!
-
 Case Studies1 month ago
High-Density Inks Help Specialty Printing Take Center Stage
-
 Andy MacDougall1 month ago
Functional and Industrial Printing is EVERYWHERE!
-

 Columns2 weeks ago
8 Marketing Mistakes Not to Make When Promoting Your Screen Printing Services Online
-
 Editor's Note2 weeks ago
Livin’ the High Life
-

 Thomas Trimingham2 months ago
“Magic” Marketing for Screen Printing Shops
-

 Marshall Atkinson2 weeks ago
How to Create a Winning Culture in Your Screen-Printing Business
-

 News & Trends1 month ago
What Are ZALPHAS and How Can You Serve Them in Your Print Business?