The Specialty Graphic and Imaging Association, Fairfax, VA, released the results of its Market Strategies Report from June. In the Internet category, results show that, compared to 2007, more imagers say they have a company Website, use e-mail campaigns, have links to their Website in third-party blogs, and are part of social-networking sites.
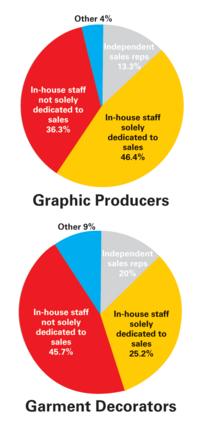
In regards to sales-staff structure, survey results show that most imagers have an in-house sales staff; however, some are not solely dedicated to sales. Graphics producers have 46.4% solely dedicated to sales, compared to the 25.2% that garment decorators have.
The top markets served by graphics producers include retail stores (65.93%), corporate branding (65.43%); ad agencies (64.20%); non-profits, associations, and organizations (52.59%); and educations institutions (49.88%). Percentages in these categories for 2007 were 56.80%, 52.70%, 53.20%, 37.90%, and 35.30%, respectively.
The top five markets for garment decorators have changed considerably. In 2007, the top five included athletic teams, educational institutions, retail, non-profits, and corporate branding. In 2008, the top five are educational institutions, non-profits, corporate branding, athletic teams, and retail.
Data for the report were compiled from the 893 responses to SGIA’s 2008 Market Trends survey, which was conducted May-June, 2008. The report can be found at www.sgia.org, keyword: surveys. SGIA members can access a comprehensive analysis of current market strategies.


 Art, Ad, or Alchemy1 month ago
 Case Studies1 month ago
 Andy MacDougall1 month ago
 Columns2 weeks ago
 Editor's Note2 weeks ago
 Thomas Trimingham2 months ago
 Marshall Atkinson2 weeks ago
 News & Trends1 month ago