Articles
Published
24 years agoon
Ideally, curing a UV ink should require no more than “dialing in” the required energy output in millijoules/cm2 on your UV dryer. For any given ink, this setting should be the same on all UV curing systems regardless of the make, model, and age of the system. But as we all know, few such ideal curing units exist in screen printing.
Typically, you not only have to figure out the energy requirement for a given ink, but you must also experiment with each and every curing unit you operate. You must determine how many lamps should be on and at what power level you should set them, plus you must try several conveyor speed settings before you can start production. In addition, you have to worry about the age of the lamps and test the settings as the lamps get older.
All this is avoidable if your UV dryers are calibrated. But the range of inks and substrates customers use makes it impractical for equipment manufacturers to calibrate their machines. So you must do it yourself. The process is relatively simple, albeit time consuming (2-4 hrs/unit). On the other hand, the calibration process will give you an opportunity to train press operators and assistants. While calibrating the system, you can teach them proper setup procedures and give them insight into how UV curing units function.
To complete calibration, you will need a stopwatch, radiometer, temperature labels or thermocouple, and a computer with a spreadsheet program. The calibration processes itself consists of the following steps:
* evaluating the accuracy and repeatability of the conveyor speed settings
* establishing the heat output at any lamp/belt-speed setting and the corresponding UV energy output (in millijoules/cm2)
* evaluating the results and preparing a graph for the settings
Conveyor-speed accuracy and repeatability
The objective of this first step is to find out if the dryer’s speed settings correspond to the actual speed of the conveyor (accuracy), and if the same dial setting corresponds to the same speed time after time (repeatability). Here’s the procedure you should follow:
1. Set the belt at 10 ft/min (or a metric equivalent) based on the unit’s speed control dial. Place an object on the belt, and measure the time it takes to travel through the UV section of the system.
2. Using the UV Calibration Data form, record the time in minutes. Do not record seconds if the conveyor speed is given in minutes–use decimal minutes (e.g., 1 min 15 sec = 1.25 min).
3. Repeat the measurements at 20 and 40 ft/min and record the times.
4. Repeat the same set of measurements once more at 10, 20, and 40 ft/min, and record the times.
5. Measure the length of the UV section and record it in feet.
One you’ve recorded these measurements, divide the conveyor length by the times. The results should be 10, 20, and 40 ft/min. If the results are within 1-2% of these figures, your conveyor’s speed is indicated accurately by the control dial. If you get other results, the speed indicator is not showing the true speed of your conveyor. However, this may not be a significant problem if the same dial position results in the same speed every time.
| ||||||
|
| ||||||
| | | |||||
|
| | | | | | |
| 1. Time in seconds |
|
|
|
|
|
|
| 2. Time in minutes |
|
|
|
|
|
|
| 3. UV section time (actual speed) |
|
|
|
|
|
|
| 4. % diff. between actual/setting |
|
|
|
|
|
|
| 5. % Repeatability |
|
|
|
|
|
|
|
| ||||||
|
|
| ||||
| | | | | | ||
|
|
|
|
|
|
|
|
|
|
|
|
|
|
|
|
|
|
|
|
|
|
|
|
|
|
|
|
|
|
|
|
|
|
|
|
|
|
|
|
|
|
|
|
|
|
|
|
|
|
|
|
|
|
|
|
|
|
|
|
|
|
|
|
|
|
|
|
|
|
|
|
|
|
|
|
|
|
|
|
If the two sets of time measurements for 10, 20, and 40 ft/min fall within 2% of one another, your conveyor speed is repeatable (even if the speed was not shown accurately on the dial). Repeatability is far more important than the actual speed of the conveyor for the calibration of your unit. The conveyor speed must be repeatable within 2% for highly accurate calibration and 4% for acceptable calibration. If the repeatability of your speed setting is worse than 4%, do not proceed with the calibration until the conveyor speed control is repaired or replaced.
Establishing energy output
The purpose of this step is to create a control graph that accurately shows the relationship between various UV reactor settings, the heat, and UV output.
Heat Some heat in UV curing is not only acceptable, but desirable. All chemical reactions (including UV-initiated ones) will take place faster at higher temperatures. Too much heat, however, is detrimental to your substrate (it may shrink, expand, change color, or react to heat in some other undesirable way). Therefore, it is important to know the temperature profile of the unit as well as its UV output.
The temperature rise in your cured material is proportional to the amount of UV energy that your lamps generate. This is true for all types of UV reactors. However, the temperature rise is smaller with water-cooled lamps or units that use IR-filtering reflectors than with uncooled, unfiltered lamps.
You can use temperature labels to measure heat exposure on substrates up to 10 mils thick. The labels should have a temperature range that covers the operating temperature of your substrates. For example, if the maximum temperature that your substrate can withstand is 180°F, you should use labels with 150, 160, 170, 180, 190, and 200°F indicators. If you use many different substrates, be sure to select the substrate with the highest temperature rating.
If your typical substrate is thicker than 10 mils, or if you need very accurate temperature readings, use a digital thermocouple instead of temperature labels. Make certain there is sufficient space between the belt and the entrance of the curing chamber to allow the thermocouple to pass through. Then proceed with temperature calibration by following these steps:
1. Start the calibration process at the highest energy setting (with all the lamps at full power) and at a belt speed that is slightly higher than normal production speed (or the manufacturer’s recommendations).
2. Send your substrate and temperature label (or thermocouple) through the unit and record the temperature at that particular speed.
3. Repeat this process at decreasing conveyor speeds (e.g., 5 ft/min increments) until you meet or exceed the temperature rating of your substrate. Record all the temperature changes at the various belt speeds.
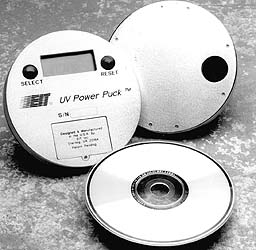
UV Output Evaluating the UV energy output of your unit at various speeds and lamp settings is similar to the temperature calibration, except that you must use a radiometer (Figure 2) instead of a thermocouple or temperature label. Note that there are more possible settings to measure, since the number of lamps and power combinations can be varied.
1. Begin by measuring the unit’s UV energy (in mJ/cm2) with all lamps at full power at the belt speed that caused your substrate to reach the maximum allowable temperature. Record this value as the Maximum UV Input (MUI) applicable to your substrate.
2. With all the lamps still at full power, record the unit’s UV output at the same speeds you selected for the temperature measurements. Stop when you reach the MUI.
3. Turn one of the lamps to half power and set the belt speed 10 ft/min slower than the initial speed in step 1. Continue measuring and recording the UV data at the same speed increments as before until you reach the MUI.
4. Repeat step 2 by turning off completely the lamp that was at half power and by reducing the initial speed another 10 ft/min. Measure and record the UV output until you reach the MUI.
5. Repeat step 3 until you have reduced the lamp power to 1 lamp with corresponding reductions in belt speed. For example, if your unit has three lamps, you will have five sets of measurements: • three lamps full power (3.0 lamps) • two lamps full power, one lamp half power (2.5 lamps) • two lamps full power (2.0 lamps) • one lamp full power, one lamp half power (1.5 lamps) • one lamp full power (1.0 lamps)
It is usually not worth evaluating one lamp at half power since the energy level will be too low to cure most UV inks. However, if you happen to work with UV inks that require less than 100 mJ to cure, you must perform this evaluation. With a two-lamp unit, you will have three possible settings and with a four-lamp unit, seven settings. Of course, if your unit has no half-power settings, the number of calibration measurements will be the same as the number of lamps.
Once you take the measurements and record all the data, enter the results in a spreadsheet program with graphic capabilities. If you used the UV Calibration Data form, you can enter the data the same way it is shown on the form, where the first column will be belt speed, the next column temperature, and the rest of the columns the UV energy.
Prepare an XY graph of the speed and temperature data using the graphic utilities of your software. The first column (speed) will represent your X axis, and the second column (temperature) the Y axis. The graph should be similar to the temperature graph in Figure 3, showing a slightly curved line. If you have spikes larger than 10°F from this line, then your measurements are inaccurate.
Next, you have to determine the relationship between heat and UV energy. Look up on your UV Calibration Data form the minimum and maximum temperatures (second column) and the corresponding minimum/maximum UV values (third column). Subtract the minimum UV value from the maximum value, and do the same with the temperature values. Divide the resulting temperature difference by the UV difference and you will have the equivalent temperature rise per unit of UV energy. For example, if your maximum/minimum UV values were 315 and 100 mJ, and the corresponding temperature changes 190°F and 125°F, then the equation will look like this:
This means that for every millijoule change, the temperature also changes 0.3°F within the range of your testing.
This figure is very accurate in the 100-200°F range, but less accurate outside of this range. If you need to know the temperature at very high or very low energy levels, you must measure (rather than extrapolate) the temperature. Add the temperature information to the UV control graph that you will prepare in the next step.
To generate the UV control graph, use the data in the first column of the UV Calibration Data form (conveyor speed) for the X axis and the UV energy measurements for the various lamp settings (shown in the third and following columns) for the Y axis. The graph should look similar to the UV control graph shown in Figure 4. Note that this particular graph is based on three lamp settings. If the lines on your graph are interrupted by empty spaces, you must add more values to your spreadsheet. You can determine these values in two ways:
1. Run some more tests at the settings for which you have no values.
2. Extrapolate the missing values from your existing values.
Using the UV control graph
The first step you should take is to note on the graph the date and the lifetime (hours used) of the lamps at the time you calibrated the unit (usually indicated on the dryer on an “hours” counter). Next, mount a copy of the graph on the UV curing unit, and use it to quickly set the unit for any desired energy output.
Train the operators in the use of the graph and include the following details in your setup procedures:
• how to determine the required UV energy (in mJ) for curing, based on the ink-manufacturers’ data sheet or in-house specifications
• how to choose the slowest conveyor speed that is required for production
• how to select the lamp configuration that will give you the required UV energy.
Consider this example: The energy recommended to cure a particular UV ink is 150 mJ/cm2. You would like to run the conveyor at 30 ft/min to keep up with production.
The graph in Figure 4 shows that 1.5 lamps (one lamp at full, the other lamp at half power) come closest to this requirement. At this lamp setting, you will have to reduce the speed to 28 ft/min to get 150 mJ (where the lamp line intersects the 150 mJ line). Alternately, you can increase the speed to 39 ft/min and use a two-lamp setting.
The Control Graph can be used throughout the life of the lamps. As you periodically check the output of the lamps (with the radiometer), you will notice that after a while, the settings on the chart will stop corresponding to the actual output of the unit. At this time, you must draw a new parallel line with the existing lamp-lines (dashed line on Figure 4).
If, for example, you find that two lamps at 30 ft/min only give you 185 mJ instead of 205 mJ (as shown on the graph), draw a line parallel with the 2 lamp-line that crosses through the 185 mJ point on the 30 ft/min line. The newly drawn lamp line will show that you must reduce the belt speed to about 28 ft/min to get 205 mJ with the aged lamps.
Conclusion
Although it takes time to calibrate a UV curing system, the benefits of accurate dryer performance data can’t be overstated. An accurate profile of your dryer’s energy output will reduce the time it takes to set the unit for particular ink/substrate combinations. And by periodically remeasuring system performance, you’ll catch problems such as aging lamps and inaccurate conveyor speed controls before they result in expensive waste prints.
About the author
Tamas S. Frecska is former editor and associate publisher of Screen Printing magazine. With more than 30 years of experience in the industry, he has been involved in print production, manufacturing, and consulting. He is presently CEO of Sarasota, FL-based Encore Engineering, Inc., a manufacturer of squeegee maintenance equipment.


Subscribe

Magazine
Get the most important news
and business ideas from Screenprinting Magazine.
Most Popular
-

 Case Studies2 months ago
High-Density Inks Help Specialty Printing Take Center Stage
-

 Art, Ad, or Alchemy2 months ago
F&I Printing Is Everywhere!
-
 Andy MacDougall2 months ago
Functional and Industrial Printing is EVERYWHERE!
-

 Columns3 weeks ago
8 Marketing Mistakes Not to Make When Promoting Your Screen Printing Services Online
-

 Editor's Note3 weeks ago
Livin’ the High Life
-

 Marshall Atkinson3 weeks ago
How to Create a Winning Culture in Your Screen-Printing Business
-

 Thomas Trimingham2 months ago
“Magic” Marketing for Screen Printing Shops
-

 News & Trends2 months ago
What Are ZALPHAS and How Can You Serve Them in Your Print Business?