Graphics Printing
Published
16 years agoon
Accumulative density is a term you might not recognize. It represents a way we can effectively measure, evaluate, and control color. And although many color experts mean well when they say density is not color, you will discover that accumulative density is color and is a serious tool that screen and digital printers can use to manage color in prepress and production. This article will explain accumulative density in detail and provide information about how to use it in assessing gray balance, four-color-process prints, ink hue, and substrate color.
Accumulative density is a term you might not recognize. It represents a way we can effectively measure, evaluate, and control color. And although many color experts mean well when they say density is not color, you will discover that accumulative density is color and is a serious tool that screen and digital printers can use to manage color in prepress and production. This article will explain accumulative density in detail and provide information about how to use it in assessing gray balance, four-color-process prints, ink hue, and substrate color.
What is accumulative density?
To accumulate means to grow by gradual additions, and density—in this context—refers to a translucent medium’s degree of opacity. Both definitions are very accurate descriptions of this exciting method of quantifying and managing process-color printing. We print with translucent colors in four-color process. Some people say we print with transparent colors, but we don’t. The difference is translucent means to allow light to pass through diffusely, so that objects on the other side cannot be seen clearly. Transparent means allowing light to pass through with little or no interruption or distortion, so that objects on the other side can be clearly seen.
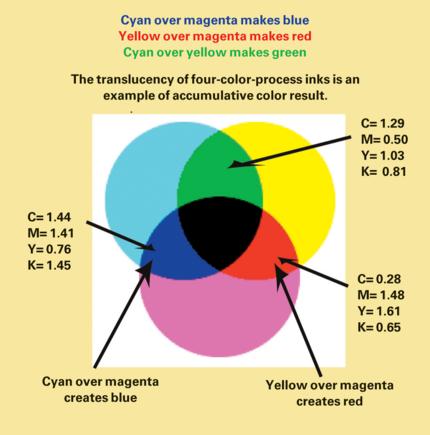
Consider the following example. Because our four-color-process inks are translucent, printing yellow over magenta results in red. This is an accumulative result of yellow and magenta. If we print cyan over magenta, the result is blue—or the accumulative result of cyan and magenta (Figure 1). Of course we can measure the result with a spectrophotometer and compare the result to a color target and calculate a delta E. But why not convert the values to density using the same data? Would that be more understandable to a printer who’s working in CMYK? The answer is yes. It is also why we need to understand how accumulative density works.
First of all, to measure accumulative density you need a spectrophotometer that collects information in the form of spectral data. The spectrophotometer collects the data by transmitting light to the substrate, measuring reflected light, and then reporting its findings in L*a*b*, L*C*H*, XYZ, or in density. If we want to know the density, the default of the device is to report the dominant spectral response in a density equation. One important bit of information to take note of here is that the same data are used to calculate density, as well as L*a*b*, L*C*H*, or XYZ values. Therefore, to say density is not color shows a lack of understanding that the collected information is the same, but simply reported in a different form.
Setting up the spectrophotometer
All modern spectrophotometers come out of the box with a density default setting in the Automatic mode. That means when you read density in this mode, the response is the dominant spectral value reported as C, M, Y, or K (Figure 2). However, most modern spectrophotometers also have an option of viewing all of the spectral values of C, M, Y, or K. I leave my device set up like this most of the time because I want to see all of the values, not just the dominant density. So the first order of business to use accumulative density is to set up your spectrophotometer to report all of the colors. You’ll be ready use accumulative densities once you’re able to read a color and see all the densities.
Accumulative density in gray balance
Gray-balance evaluation is another extremely valuable use of this powerful measuring method. As you know, the objective of print production is printing a client’s file accurately. But many times we don’t have an accurate proof or even a proof at all. The client just gives us a file, slaps us on the back and says, “Have a nice day, but if you goof up my art, I’ll kill you.” The power of accumulative density can solve the problem of knowing a print is accurate to the file without a proof.
Here’s how it works. The objective in producing any color image is to print the image with no cast. If we accomplish this task, then we’ll have accurately represented the original file. We don’t have to have a client’s proof to know, or prove, that the print is accurate. We only have to show that we have not added a blue cast, a red cast, a green cast, or a yellow cast to the original. Neutral-gray-print production is critical to confirming that the result of our print is accurate. Our lives in the print world become clear and meaningful when we grasp this concept. Those who fail to learn this may live their days mired in subjective opinion and unclear objectives.
We all say we know neutral gray is important, but how do most people judge neutral gray? I submit that most people simply look at the gray. They use the world famous chin-o-meter as they stand on one foot with their left hand on their chin and say to themselves, “Self, I believe that is neutral gray.” What I find is most of the time they are dead wrong. The reason I am bold enough to say that is because I evaluate proofs at different graphics-production facilities every week. Most of the time the neutral gray that they are professing to use is actually blue cast—and most of the time it is blue cast because it’s missing yellow. Using the spectrophotometer in the All mode quickly verifies whether a gray is neutral or has a cast in it. The device’s findings are not subjective opinions.
Accumulative density confirms neutral gray (Figure 3) via the spectrophotometer in the All mode, which reads a gray patch that is built from C, M, and Y. You can verify neutral gray when the density values of C, M, and Y are equal. Notice in Figure 3 the C, M, and Y, are perfectly balanced on the left, but the blue-cast gray on the right is missing some yellow. You can see shifts in as few as two points, but they’re normally not noticeable. Shifts of more than three points become noticeable and objectionable. You’d be very quick to detect five points of deviation visually.
The practical use of this very accurate gray-balance check is for the time when a client says you have not accurately represented an image file in print. You can actually prove that you have accurately produced the file by presenting the evidence of neutral gray on the print’s color bar. Removing the subjectivity of a person’s opinion from the decision-making process allows you to move production forward and boost a client’s confidence. In summary: Use accumulative density to measure, evaluate, and control neutral grays. Depend on it to verify the accuracy of your work. Validating neutral gray is the most useful function of accumulative density.
Accumulative density in four-color process
The next very useful application of accumulative density is in the evaluation of four-color-process images compared to a measureable color target. Our measureable color targets may or may not include color bars. If they do, we can read the densities of the targets’ solids and the solids of our print. We can even read the tonal values on the color bars. But we can also read, evaluate, and control the print area through accumulative density.
If, for example, we have a print that is too red when compared to a color target, how should we fix the issue? Most printers would naturally try to remedy the problem by reducing the amount of magenta—the wrong color move. However, accumulative density can show us what’s causing the color deviation. If we measure the spot in the water on Figure 4 that looks too red on the print and compare it to the same spot on the color target, we find that magenta is not the problem. Cyan is the problem, as it’s too low. The spot on the color target measured in accumulative density is C = 1.31, M = 0.81, Y = 0.56, K = 1.03. The very same spot on the print is C = 1.22, M = 0.81, Y = 0.57, K = 1.00. We also find that the solid density on the color bar is the same as the color target, so the problem is certainly not the solid color. The cyan’s tonal percentage is too low, narrowing the issue to a problem in prepress or on press.
What we learn here is that the accumulative values in the print area are relevant from print to color target. Individual density results in the image area can often exceed those of your solids on your color bars. Remember, this is accumulative. That means that if the value you read is an accumulated total of all the light re-flectance of what you’re measuring, then you’re adding some of all color values from all colors present. Look at Figure 1 again. Its cyan value is 1.44 cyan, printed over magenta. Wow! How could this happen? We’re only printing with a 1.30 solid! How can we have 1.44? Because the magenta solid and the yellow solid also contain cyan spectral values. The value we read here is an accumulation of all of the values. The substrate also adds to the values. So by knowing and understanding this, we realize that the measurement we’re comparing is very accurate and useful because it shows us everything going on the image area and compares our result to an intended color target.
Accumulative density in ink hue
You can use your spectrophotometer’s accumulative-density feature to evaluate ink hue reported in CMYK. As mentioned earlier, evaluating a solid in L*a*b* is not a problem, but a report in CMYK is more relevant to a printer. For example, let’s say we’ve reviewed a spectro’s L*a*b* evaluation and found the problem to be a reading toward the blue side of the b axis. Why is it blue cast? A look at the CMYK breakdown using the same data would reveal missing yellow, while the L*a*b* would report a blue shade ma-genta. Instead, we find the fix in the CMYK. What we learn here is that reporting the solids in CMYK is very useful and accurate—certainly not any more accurate than L*a*b*, but much more clear as to why the solids are different.
Accumulative density in substrate color
Substrate evaluation is accumulative density’s final, very useful, function. Again, we can read the substrate in L*a*b* and use the same data to calculate the substrate’s CMYK values. These CMYK numbers give us some help in evaluating color-matching issues caused by the substrate. A so-called neutral-white substrate adds no cast to the print. Neutral, according to ISO 12647-5, the ISO screen-print standard, is defined for #1 grade paper as L* 93, a* 0, b* -3 (Table 1).
| Item | Characteristic | |||||
| L* 1 |
a* 1 |
b* 1 |
Gloss % |
ISO brightness % |
Mass-per-area g/m2 |
|
| Paper type | ||||||
| Gloss coated, wood-free | 93 (95) | 0 (0) | -3 (-2) | 65 | 89 | 115 |
| Matte-coated, wood-free | 92 (94) | 0 (0) | -3 (-2) | 38 | 89 | 115 |
| Gloss-coated, web | 87 (92) | -1 (0) | 3 (5) | 55 | 70 | 70 |
| Uncoated, white | 92 (95) | 0 (0) | -3 (-2) | 6 | 93 | 115 |
| Uncoated, slightly yellowish | 88 (90) | 0 (0) | 6 (9) | 6 | 73 | 115 |
| Tolerance | +/- 3 | +/- 2 | +/- 2 | +/- 5 | – | – |
| Reference paper | 94,8 | -0.9 | 2,7 | 70 to 80 | 78 | 150 |
The interpretation of the number here is that the 93 represents a white value in darkness and lightness. The higher the number, the whiter it is. The a value represents no cast on the green/red axis, and the -3 b reading indicates a slightly blue cast.
So that’s what neutral is, according to an ISO standard. That’s great, but what did the standard do for your understanding of how much cyan and magenta a styrene substrate will add to your print? The substrate’s CMY values are added directly to your print result. Print color is affected more and more as the tonal values move toward lighter tones. Understanding and measuring this effect adds tremendous value in print-color evaluation, as well as developing print curves based on different colored substrates. Therefore, the practical application of accumulative density in paper measurements, evaluation, and color control is troubleshooting and planning in prepress to compensate for the amount a print will be affected by paper color in production.
Will your graphics measure up?
Measuring accumulative density helps screen and digital printers control gray value, which is the only way to verify accuracy without a measureable proof. It assists in quick press-control decisions by comparing the printed image to an accurate color target. Accumulative density also takes the L*a*b* mystery out of ink-hue evaluation. Finally, it’ll help you to better understand and control the effects that substrates have on your printed graphics. Your customers aren’t likely to become less demanding any time soon. If you’ve already considered the influence of accumulative density, you’re ahead of the curve. But if accu-mulative density is a new idea to you, now is the time to study it and make it a prominent part of your prepress and production processes.
Mike Ruff is chief technology officer of Nazdar Consulting Services, Shawnee, KS. He is involved in training and implementation of color-control procedures for graphics-production facilities. Ruff has actively been involved in the education of screen, digital, and flexo printers for more than 37 years. A regular speaker at industry events and seminars, Ruff is a member of the Academy of Screen Printing Technology and a certified G7 Color Calibration Expert. He’s also certified in flexographic color-management courses at RIT and has authored many articles for trade magazines domestically and internationally. He can be reached at mruff@nazdar.com.


Subscribe

Magazine
Get the most important news
and business ideas from Screenprinting Magazine.
Most Popular
-

 Case Studies2 months ago
High-Density Inks Help Specialty Printing Take Center Stage
-

 Art, Ad, or Alchemy2 months ago
F&I Printing Is Everywhere!
-
 Andy MacDougall2 months ago
Functional and Industrial Printing is EVERYWHERE!
-

 Columns3 weeks ago
8 Marketing Mistakes Not to Make When Promoting Your Screen Printing Services Online
-

 Editor's Note3 weeks ago
Livin’ the High Life
-

 Marshall Atkinson3 weeks ago
How to Create a Winning Culture in Your Screen-Printing Business
-

 Thomas Trimingham2 months ago
“Magic” Marketing for Screen Printing Shops
-

 News & Trends2 months ago
What Are ZALPHAS and How Can You Serve Them in Your Print Business?